← All MetrosDallas For Impact
Competitive Intelligence
Dallas For Impact
YouTube Benchmark
Live rankings and performance data for 136+ for-impact YouTube channels across Dallas Metro.Updated weekly







0+
Channels Tracked
0
Combined Subscribers
0
Combined Views
0
Uploads Last 90 Days
Trending Now
Past monthTop uploads by views


All-Time Leaders
Top Channels


Dallas vs. National
Benchmark Intelligence
How Dallas nonprofit YouTube channels compare to national nonprofit and industry benchmarks — and where the biggest opportunities for growth are hiding.
Subscribers
Below National
508
Dallas Median
25th–75th: 105–2.2K
National: 1.0K(NP Median)
The typical Dallas nonprofit has 508 subscribers vs. 1.0K nationally. Most local channels are in early growth — even reaching 1.0K puts you ahead of the national median.
Views / Video
Above National
552
Dallas Median
25th–75th: 170–3.2K
National: 400(NP Median)
The typical Dallas channel gets 552 views per video, close to the 400 national median.
Engagement Rate
Below National
1.10%
Dallas Median
25th–75th: 0.4%–1.6%
National: 2.5%(NP Median)
Dallas's typical 1.10% engagement trails the 2.5% national median. Adding CTAs, responding to comments, and posting Shorts can boost this significantly.
Uploads / 90 Days
Needs Work
1
Dallas Median
76 of 136 active
National: 4(Active NP Median)
The typical Dallas nonprofit uploads 1 video per 90 days vs. 4 nationally. Only 76 of 136 channels are active. Consistency is the #1 growth lever.
What the Data Tells Us
🔍
The Gap Is Real
With a median of just 508 subscribers, most Dallas nonprofits have small audiences — but that's typical for local organizations. The average (5.8K) is higher because a few large channels pull it up. Even reaching 1K subscribers puts a channel in the top quartile locally.
📊
Why Medians Matter
We use medians because a few large channels (avg: 5.8K subs) skew the average 11× higher than the median (508). The median represents what the typical Dallas nonprofit actually looks like — and what you should benchmark against.
🚀
Biggest Growth Lever
60 of 136 channels haven't uploaded in 90 days. Consistency is the #1 predictor of growth. Channels posting weekly see 3-5× more views than monthly posters. This is Dallas's biggest opportunity.
National benchmarks sourced from M+R Benchmarks 2025, Rival IQ, Dash Social, and Social Blade nonprofit category data (2024–2025).
Subscriber Distribution
Where most channels fall — the majority have under 5K subscribers
Dallas Nonprofit Growth Playbook
Data-backed priorities ranked by potential impact — where Dallas nonprofits should focus to close the gap with national benchmarks
📅
Upload Consistency Is #1
High Impact60 inactive channels
60 of 136 channels haven't uploaded in 90 days. YouTube's algorithm rewards consistency — channels posting at least 2×/month see 3-5× more views than those posting sporadically. This is the single biggest lever for Dallas nonprofits.
💬
Close the Engagement Gap
High Impact1.10% vs. 5.4% national
Dallas's 1.10% median engagement is below the 5.4% national average for small channels. Quick wins: add a CTA in the first 30 seconds, pin a comment with a question, and respond to every comment within 1 hour to boost algorithmic ranking.
🔎
Fix Discoverability
High Impact552 vs. 2K national
The median Dallas channel gets 552 views/video vs. 2,000 nationally for similar-sized channels. Optimize titles for search (use keywords your audience Googles), create custom thumbnails with faces and text, and use 8-12 relevant tags per video.
🎯
Break the 1K Subscriber Barrier
Medium ImpactMedian: 508 subscribers
Half of all Dallas nonprofit channels have fewer than 508 subscribers. Reaching 1K unlocks YouTube monetization features and puts you in the top quartile locally. End screens, cross-promotion on email newsletters, and consistent thumbnails accelerate subscriber growth.
See how your channel compares to these benchmarks
Get a free YouTube audit with personalized recommendations in 30 seconds
AI Spotlight
Editor's Picks
Channels selected by AI for exceptional content quality and impact

6/10
Inaugural Lecture: Lives of the Gods Divinity in Maya Art

Kimbell Art Foundation
5.5K subscribers
The channel achieves a strong 36.2% view-to-subscriber ratio and an above-average 2.6% engagement rate. Content focuses on educational 'Close Look' series and exhibition lectures, though momentum has stalled with no uploads in 72 days.
high

6/10
Lookin' for Dinos

Spca Of Texas
3.7K subscribers
The channel boasts an exceptional 3.83% engagement rate and a strong 40.1% view-to-subscriber ratio. While posting frequency is high with 50 videos in 90 days, 0% caption coverage and generic fundraising titles limit broader editorial appeal.
highHigh-volume animal welfare c…
7/10
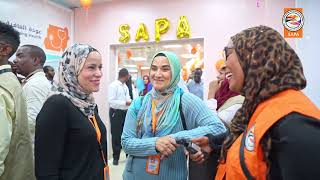
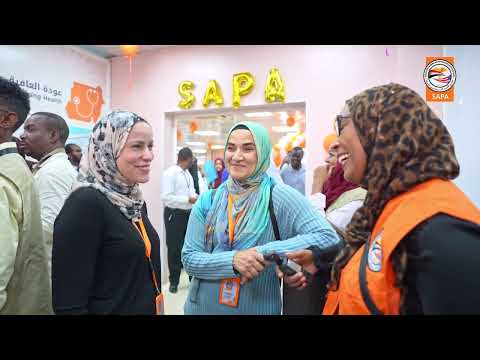
بعد أشهر من العمل والاستعداد يعود مستشفى إبراهيم مالك لاستقبال المرضى من جديد

Sudanese American Physicians Association
2.8K subscribers
SAPA maintains an impressive upload frequency with 44 videos in the last 90 days, focusing on authentic, on-the-ground humanitarian updates from Sudan. While average views are modest (270), their recent video 'Khartoum Is Quiet Again...' achieved nearly 10x their average views, proving that compelling, mission-driven storytelling resonates. However, a 0% caption rate is a significant accessibility gap.
highMedical humanitarian org del…
🏆 Curious where your nonprofit ranks?
Get an instant benchmark ranking + free YouTube audit in 30 seconds
Content Strategy
Content Format Breakdown
How Dallas nonprofits structure their YouTube content — from long-form storytelling to quick Shorts
Format Distribution
136 channels analyzed95%
Shorts-Heavy 7
Short-Form (<5m) 129
Mid-Form (5–15m) 0
Long-Form (15m+) 0
Upload Efficiency
Best avg views per video
1

Uplift Education
552 videos · 8.1M total views
2
Health Education Learning Project H E L P
51 videos · 4.4M total views
3

Childrens Health System Of Texas
1056 videos · 22.9M total views
4

Responsiveed Arkansas
216 videos · 5.9M total views
5

Broadway Dallas Inc
773 videos · 27.2M total views
Shorts Champions
Most YouTube Shorts produced


Performance
Engagement & Format


Trending NowPast month
Viral Hits
The most-viewed recent uploads across all tracked channels


2
3d ago
Behind the Scenes with VETS and Ironclad
Solutions For Vete…1.2K

3
24d ago
The Road to T7: Dallas | Unscripted Nights Tour with Tasha Cobbs Leonard
Td Jakes Foundation1.2K

4
17d ago
A dialogue between movement, architecture, and sculpture
Nasher Sculpture C…783

5
18d ago
Photography’s First Century: Masterworks from the Bibliothèque nationale de France
Kimbell Art Founda…443

6
14d ago
🎃 Consider this your sign to make a Halloween thrift trip.
Goodwill Industrie…418

7
22d ago
DBDT Presents: DanceAfrica Dallas 2026
Dallas Black Dance…378
Community Builders
Comment Magnets
Channels sparking the most conversation — ranked by average comments per video
#
Channel
Avg Comments
1

Center For American And International Law
2.1K subs · 2.1K avg views
14
2

National Breast Cancer Foundation Inc
5.1K subs · 8.0K avg views
11
3

Fort Worth Zoological Association Inc
10.6K subs · 14.2K avg views
10
4

Elephant Havens Wildlife Foundation Inc
2.0K subs · 3.2K avg views
9
5

First Liberty Institute
7.5K subs · 18.5K avg views
9
6
Solutions For Veterans Inc
4.2K subs · 5.7K avg views
6
7

Dallas Symphony Foundation
9.3K subs · 8.1K avg views
6
8

Dallas Zoo Management Inc
25.6K subs · 2.9K avg views
4
9
Kimbell Art Foundation
5.5K subs · 2.1K avg views
3
10

Parkinson Voice Project Inc
59.6K subs · 1.5K avg views
3
Contenido en Español
Spanish-Language Content
Original Spanish-language videos from nonprofits — a critical gap in markets with large Hispanic populations

24 en español
Bilingual

The Self-Care Wheel
Genesis Womens Shelter & Support · 24 Spanish videos

13 en español
Bilingual

How to claim your stimulus payment if you don’t file taxes
Legal Aid Of Northwest Texas · 13 Spanish videos

3 en español
Bilingual
How to Perform a Breast Self-Exam
National Breast Cancer Foundation Inc · 3 Spanish videos
4%
of tracked channels have any Spanish content
6
channels with Spanish videos out of 136 tracked
0
channels with Spanish as primary language
1
Genesis Womens Shelter & Support
🌐 Bilingual · 24 Spanish videos · 486 subs
24 videos
en español
2
Legal Aid Of Northwest Texas
🌐 Bilingual · 13 Spanish videos · 509 subs
13 videos
en español
3
National Breast Cancer Foundation Inc
🌐 Bilingual · 3 Spanish videos · 5.1K subs
3 videos
en español
4
Amon Carter Museum Of Western Art
🌐 Bilingual · 3 Spanish videos · 1.5K subs
3 videos
en español
5
Guidance Center
🌐 Bilingual · 2 Spanish videos · 13.0K subs
2 videos
en español
6
Housing Channel
🌐 Bilingual · 2 Spanish videos · 58 subs
2 videos
en español
By Mission
Category Spotlights
Explore channels by mission area — click a category to see top performers
Mission Categories
Select a category
Click a mission category on the left to explore
top channels and videos in that area




💎 Could your channel be a Hidden Gem?
Small channels making outsized impact get featured. See how your content scores.
Analytics
Distribution and trends across all tracked channels
Subscriber Distribution — Top 20
Engagement Rate — Top 20
Upload Frequency — Videos in Last 90 Days
Engagement Rate vs. Subscriber Count
Bubble size = total views · Log scale on subscribers · Outliers top-left = high engagement, small audience
About RiseWorks: We produce monthly video, photo, and series content for nonprofits on a flat subscription. The Benchmark is how we give back to the sector.
Learn about our services →Join the Benchmark
Want your organization
included?
See how your YouTube channel stacks up against 136+ Dallas for-impact organizations. Get a free channel audit with personalized insights.
Data sourced from the YouTube Data API. Last updated 10/15/2026. Rankings reflect publicly available channel statistics.