StoryOS · The Operating System
Your Creative Team Comes With Its Own Operating System.
StoryOS is the AI-native storytelling operating system — it carries every story from idea to impact, and learns from the whole loop. Every RiseWorks subscription runs on it: projects, review, discovery, and the data that makes the next story better.
The Operating System
RiseWorks runs on StoryOS.
Your subscription includes the modules below — each one a step in how StoryOS carries a story from idea to impact. The full platform lives at storyos.org.
The 360° Loop
Every story makes the next one stronger
StoryOS learns across the whole pipeline. Engagement is the lever it can move; the real-world outcome is the goal. Recommendations blend three sources, and every suggestion stays a human decision the graph remembers.
Your data
Your own shoots, cuts, distribution, and outcomes — your tenant, your numbers.
The RiseWorks corpus
Anonymized, opt-in signal pooled across consenting clients. Your private data stays in your tenant.
The mission-economy benchmark
Thousands of nonprofit YouTube channels we already track daily across the country.
Distribution recommendations grounded in real YouTube and benchmark data.
Edit-structure recommendations — which hooks and pacing hold attention.
The outcome ring — donations, volunteers, awareness — and the cross-client corpus blend.
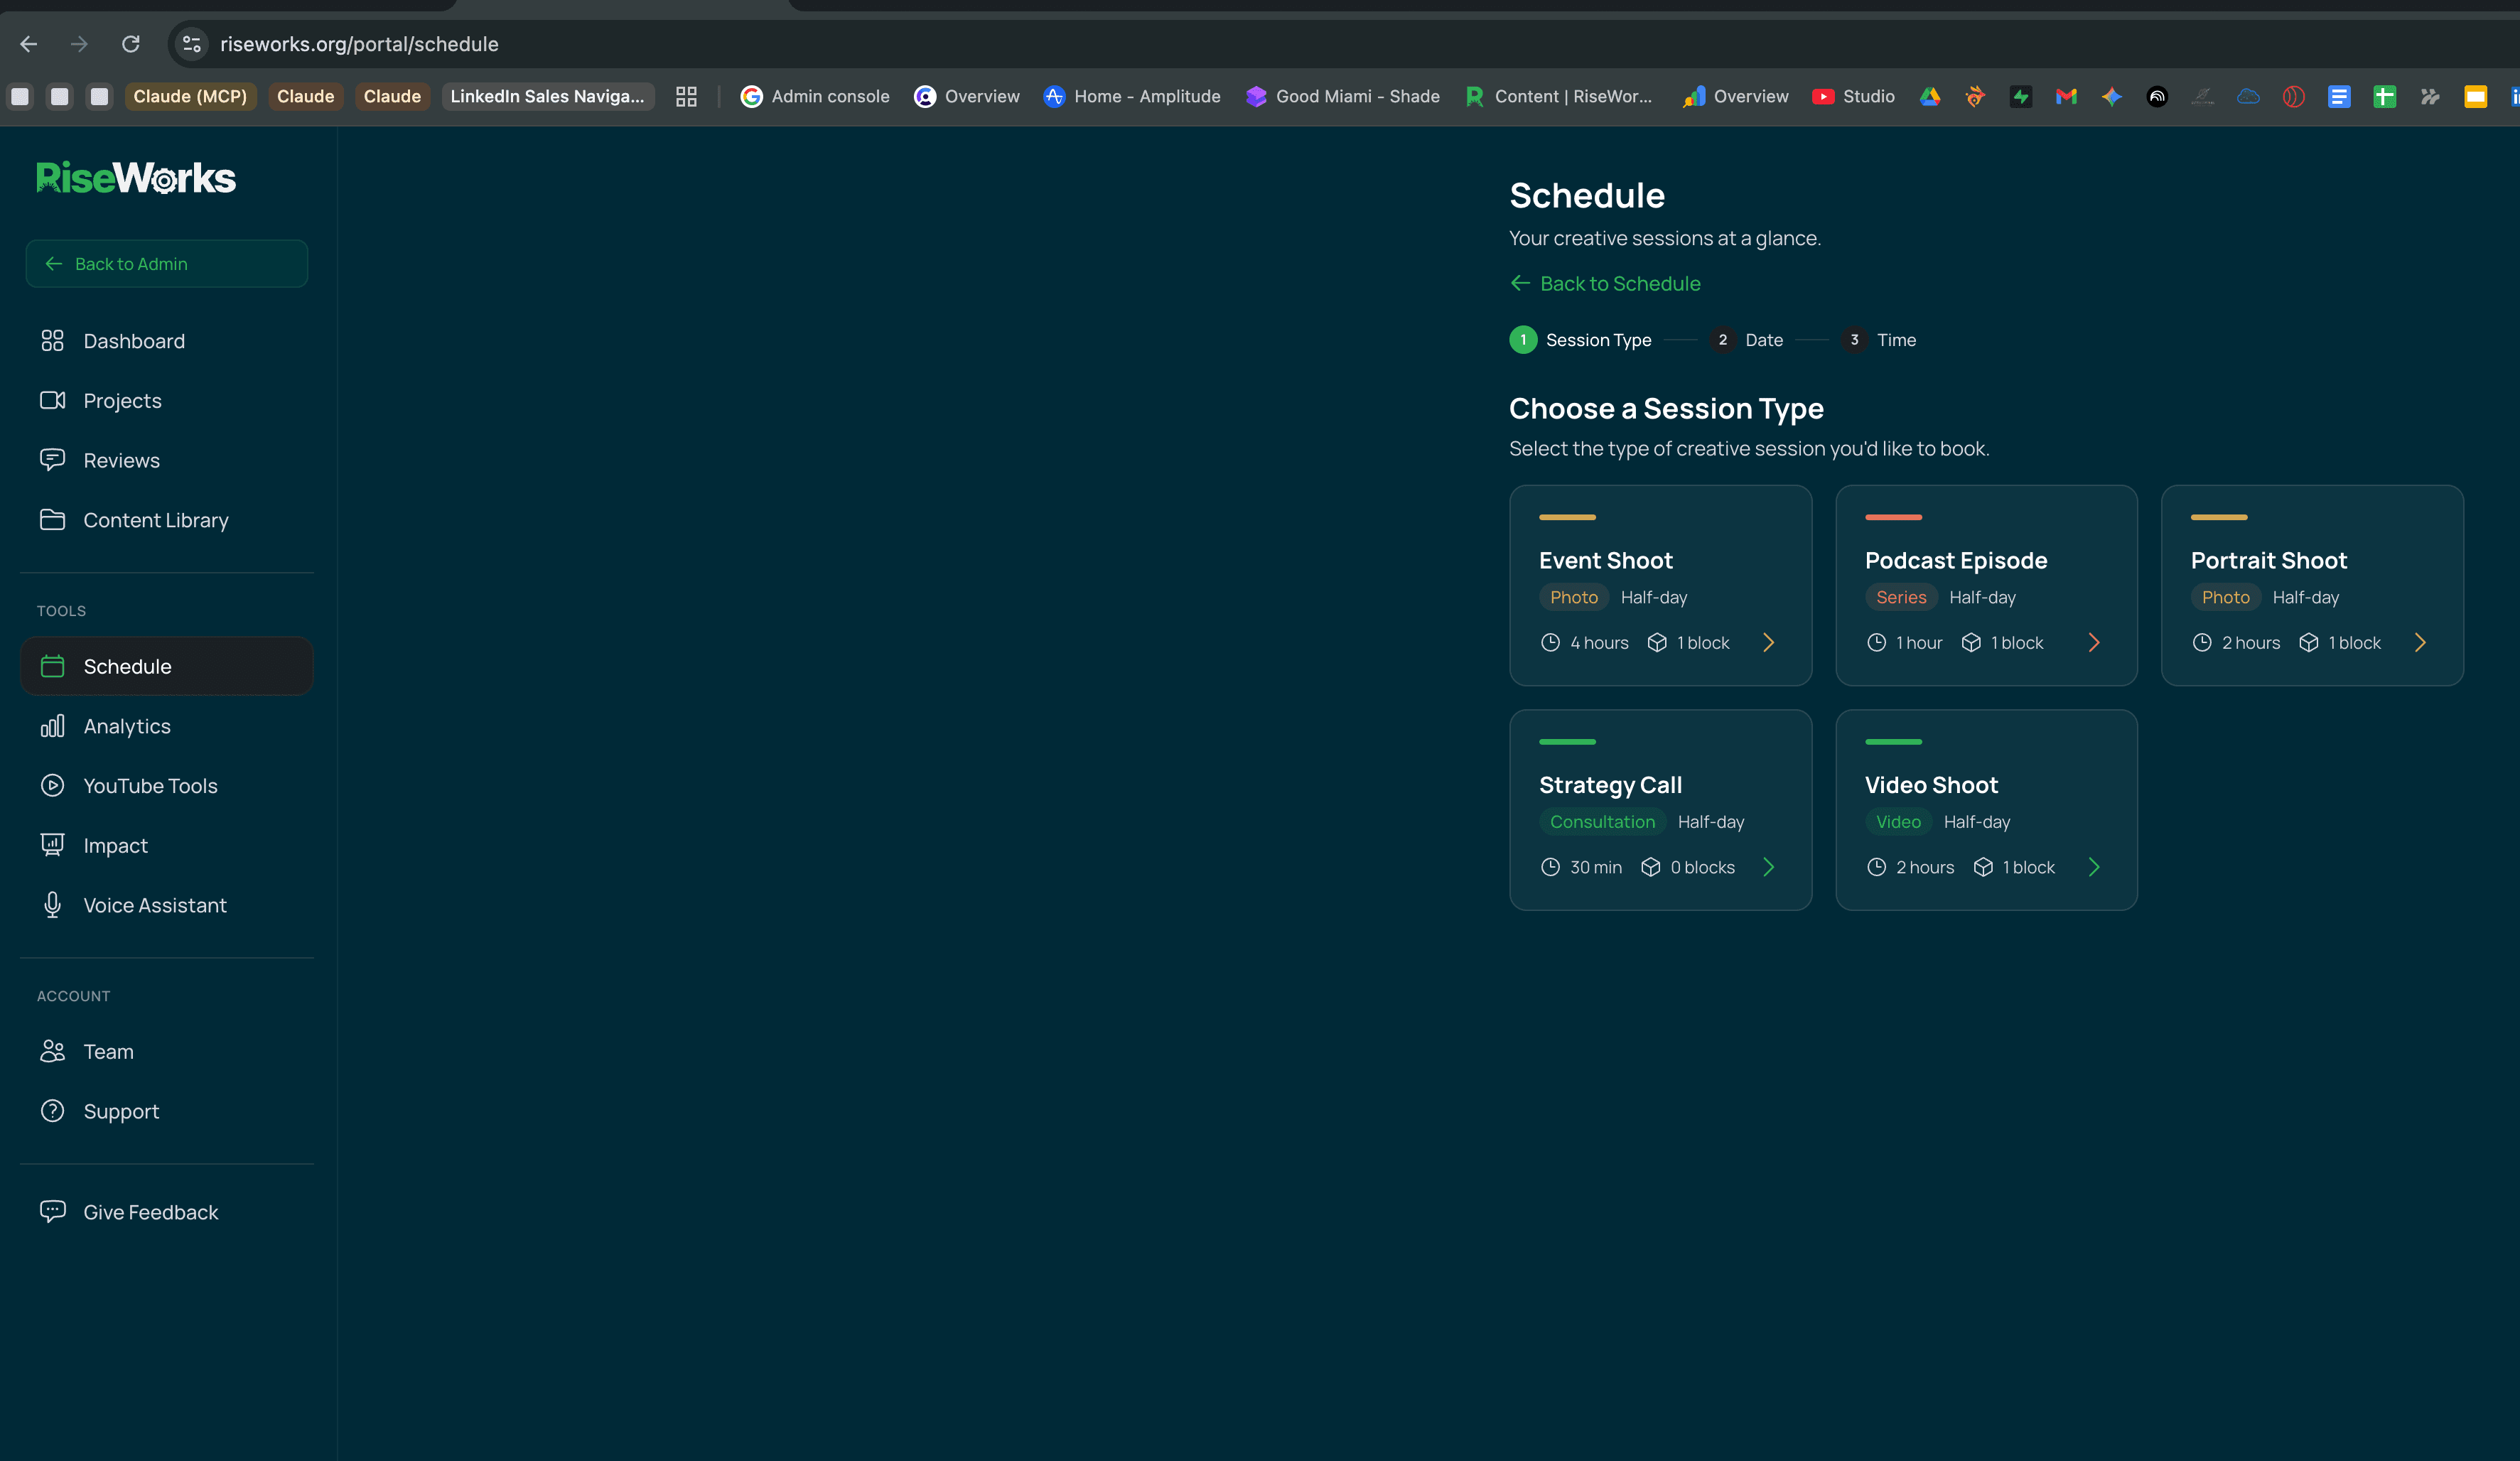
Book Sessions on Your Schedule
Your dashboard includes a built-in scheduling system with dedicated session types — video shoots, portrait sessions, podcast episodes, event coverage, and strategy calls. Storyboards turn every booking into a plan before the camera rolls, sketching every beat grounded in your brief and brand voice.
Need to schedule an interview subject or guest speaker? Generate a self-service booking link they can use directly — no back-and-forth email chains.
How it works
Session types include Video Shoot (2hr), Event Shoot (4hr), Podcast Episode (1hr), Portrait Shoot (2hr), and Strategy Call (30min).
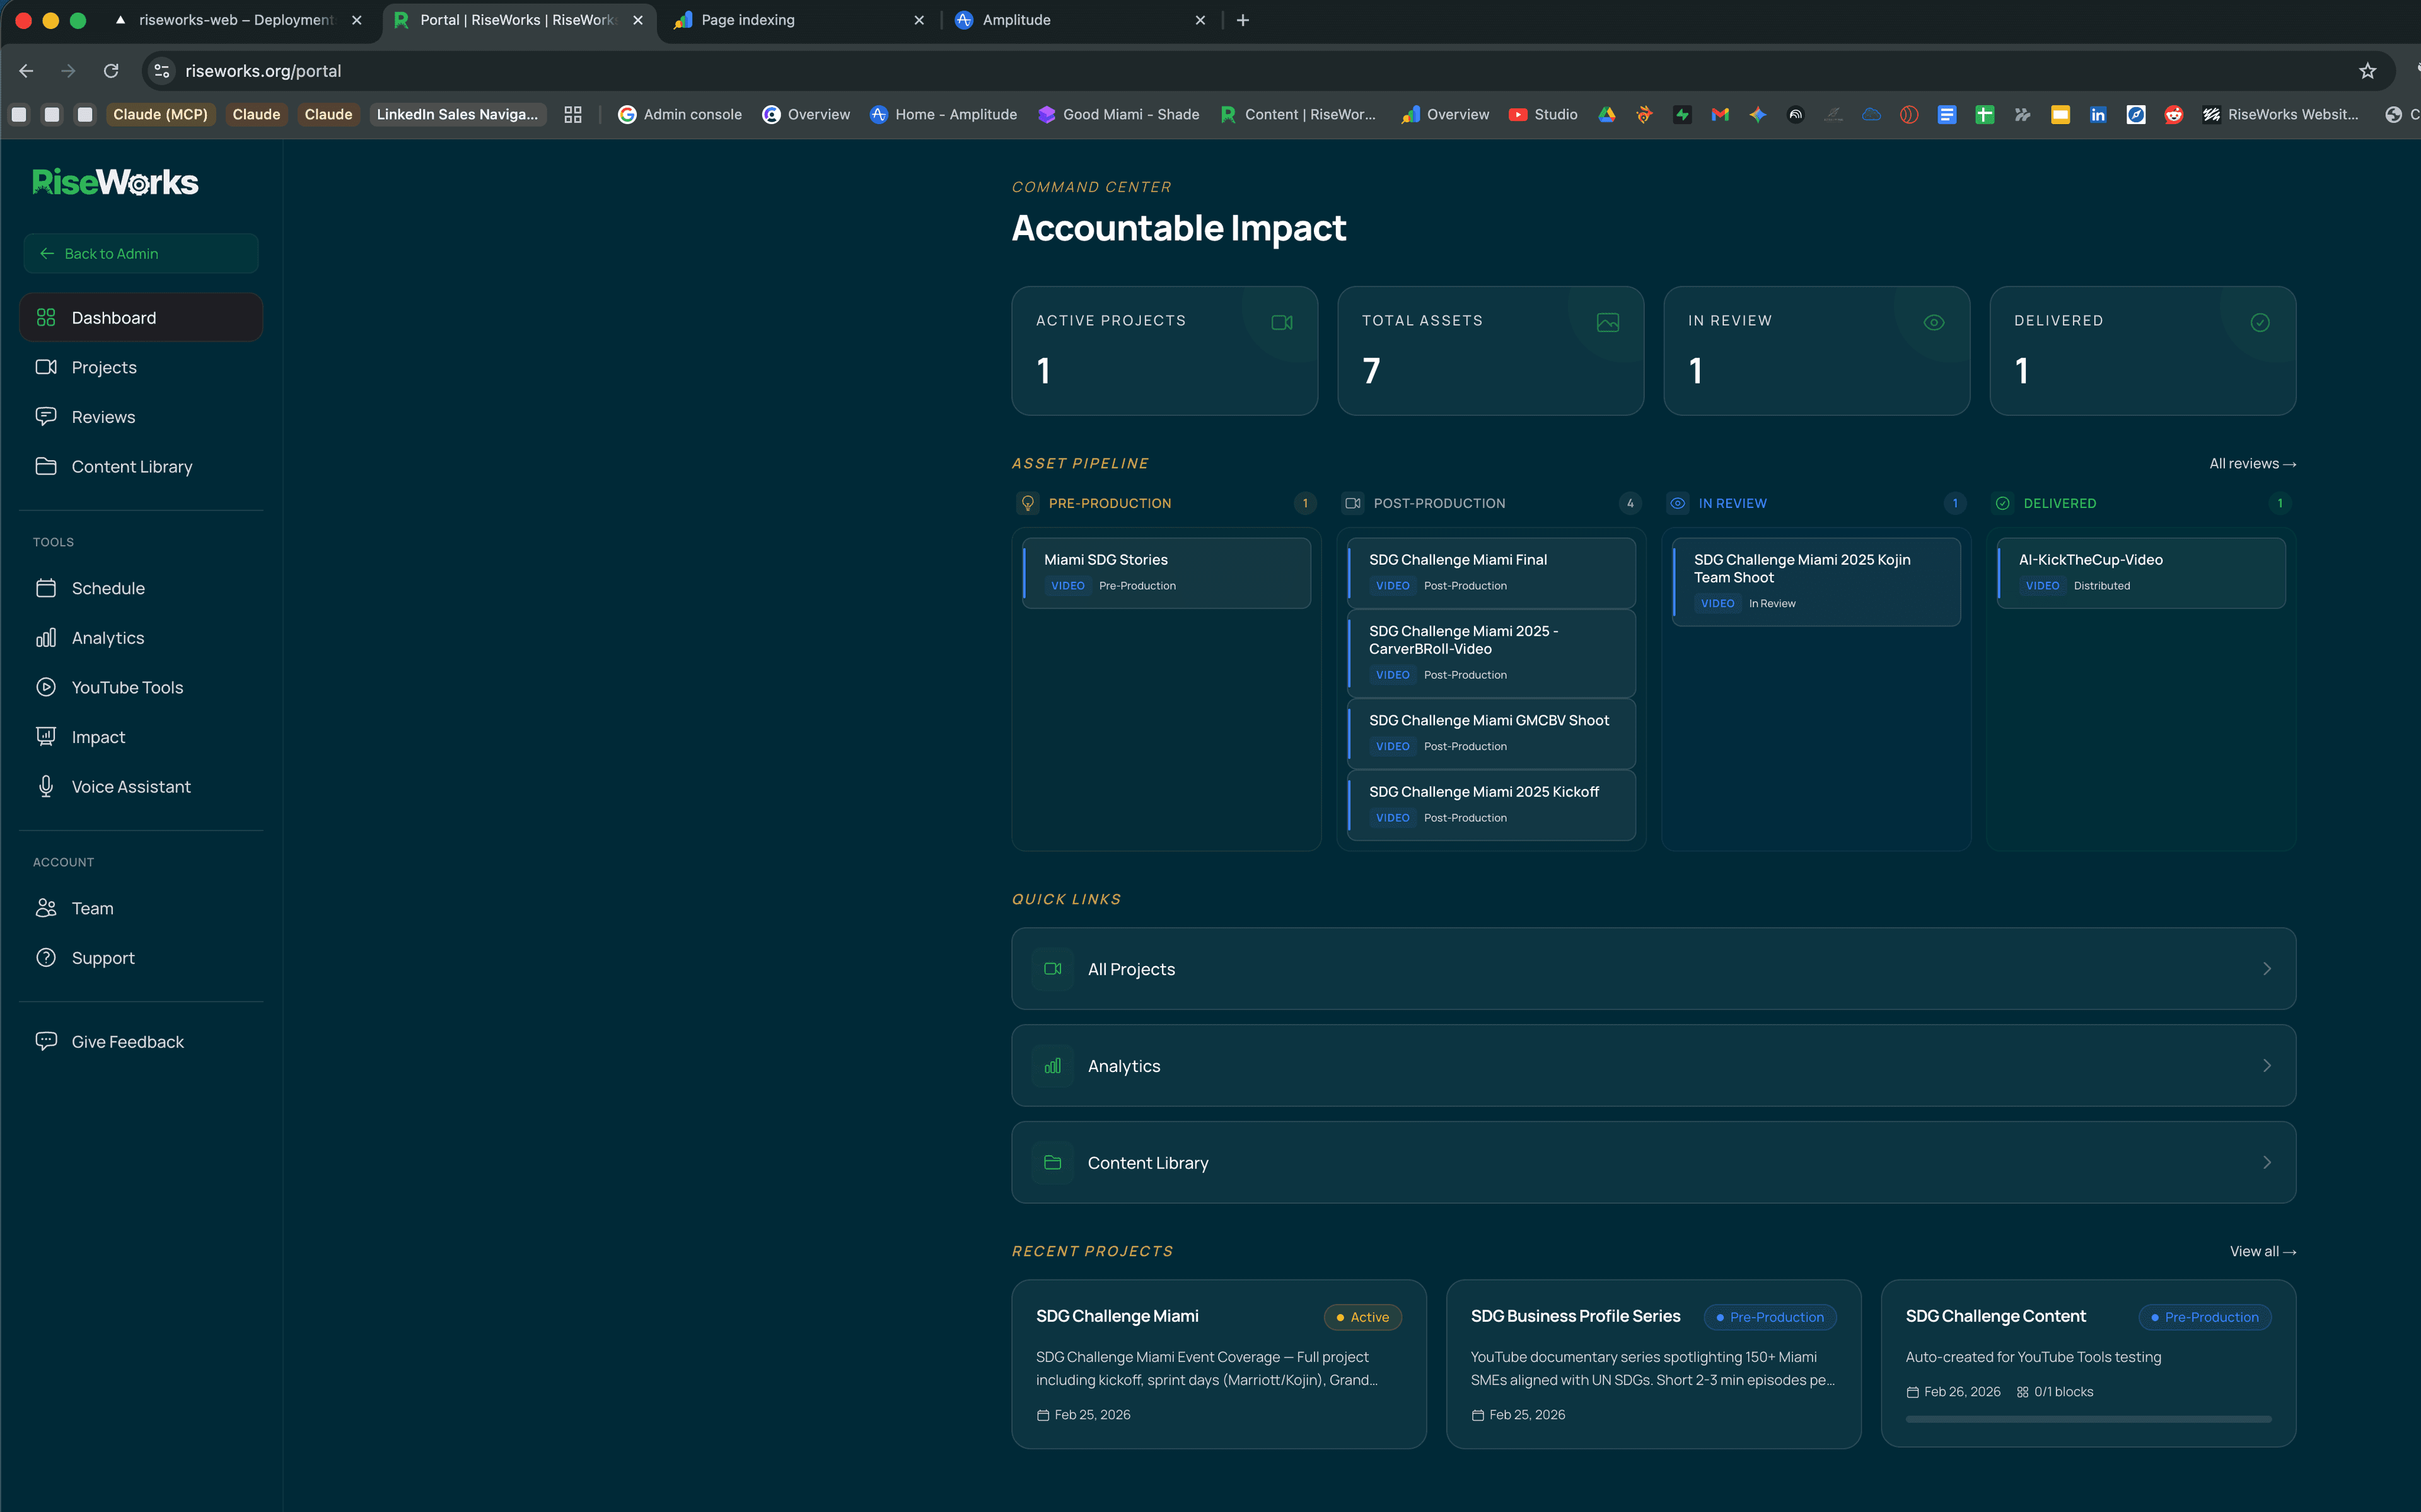
Watch Your Projects Move Through the Pipeline
Your Command Center shows every project moving through the pipeline — from pre-production through post-production, review, and delivery. Active projects, assets in progress, and what’s ready for your review, all at a glance.
Open your dashboard and see exactly where everything stands. Behind the scenes, AI-powered semantic matching automatically links your media assets to the right projects — no manual file management, no status update meetings.
How it works
Kanban-style pipeline: Pre-Production → Post-Production → In Review → Delivered
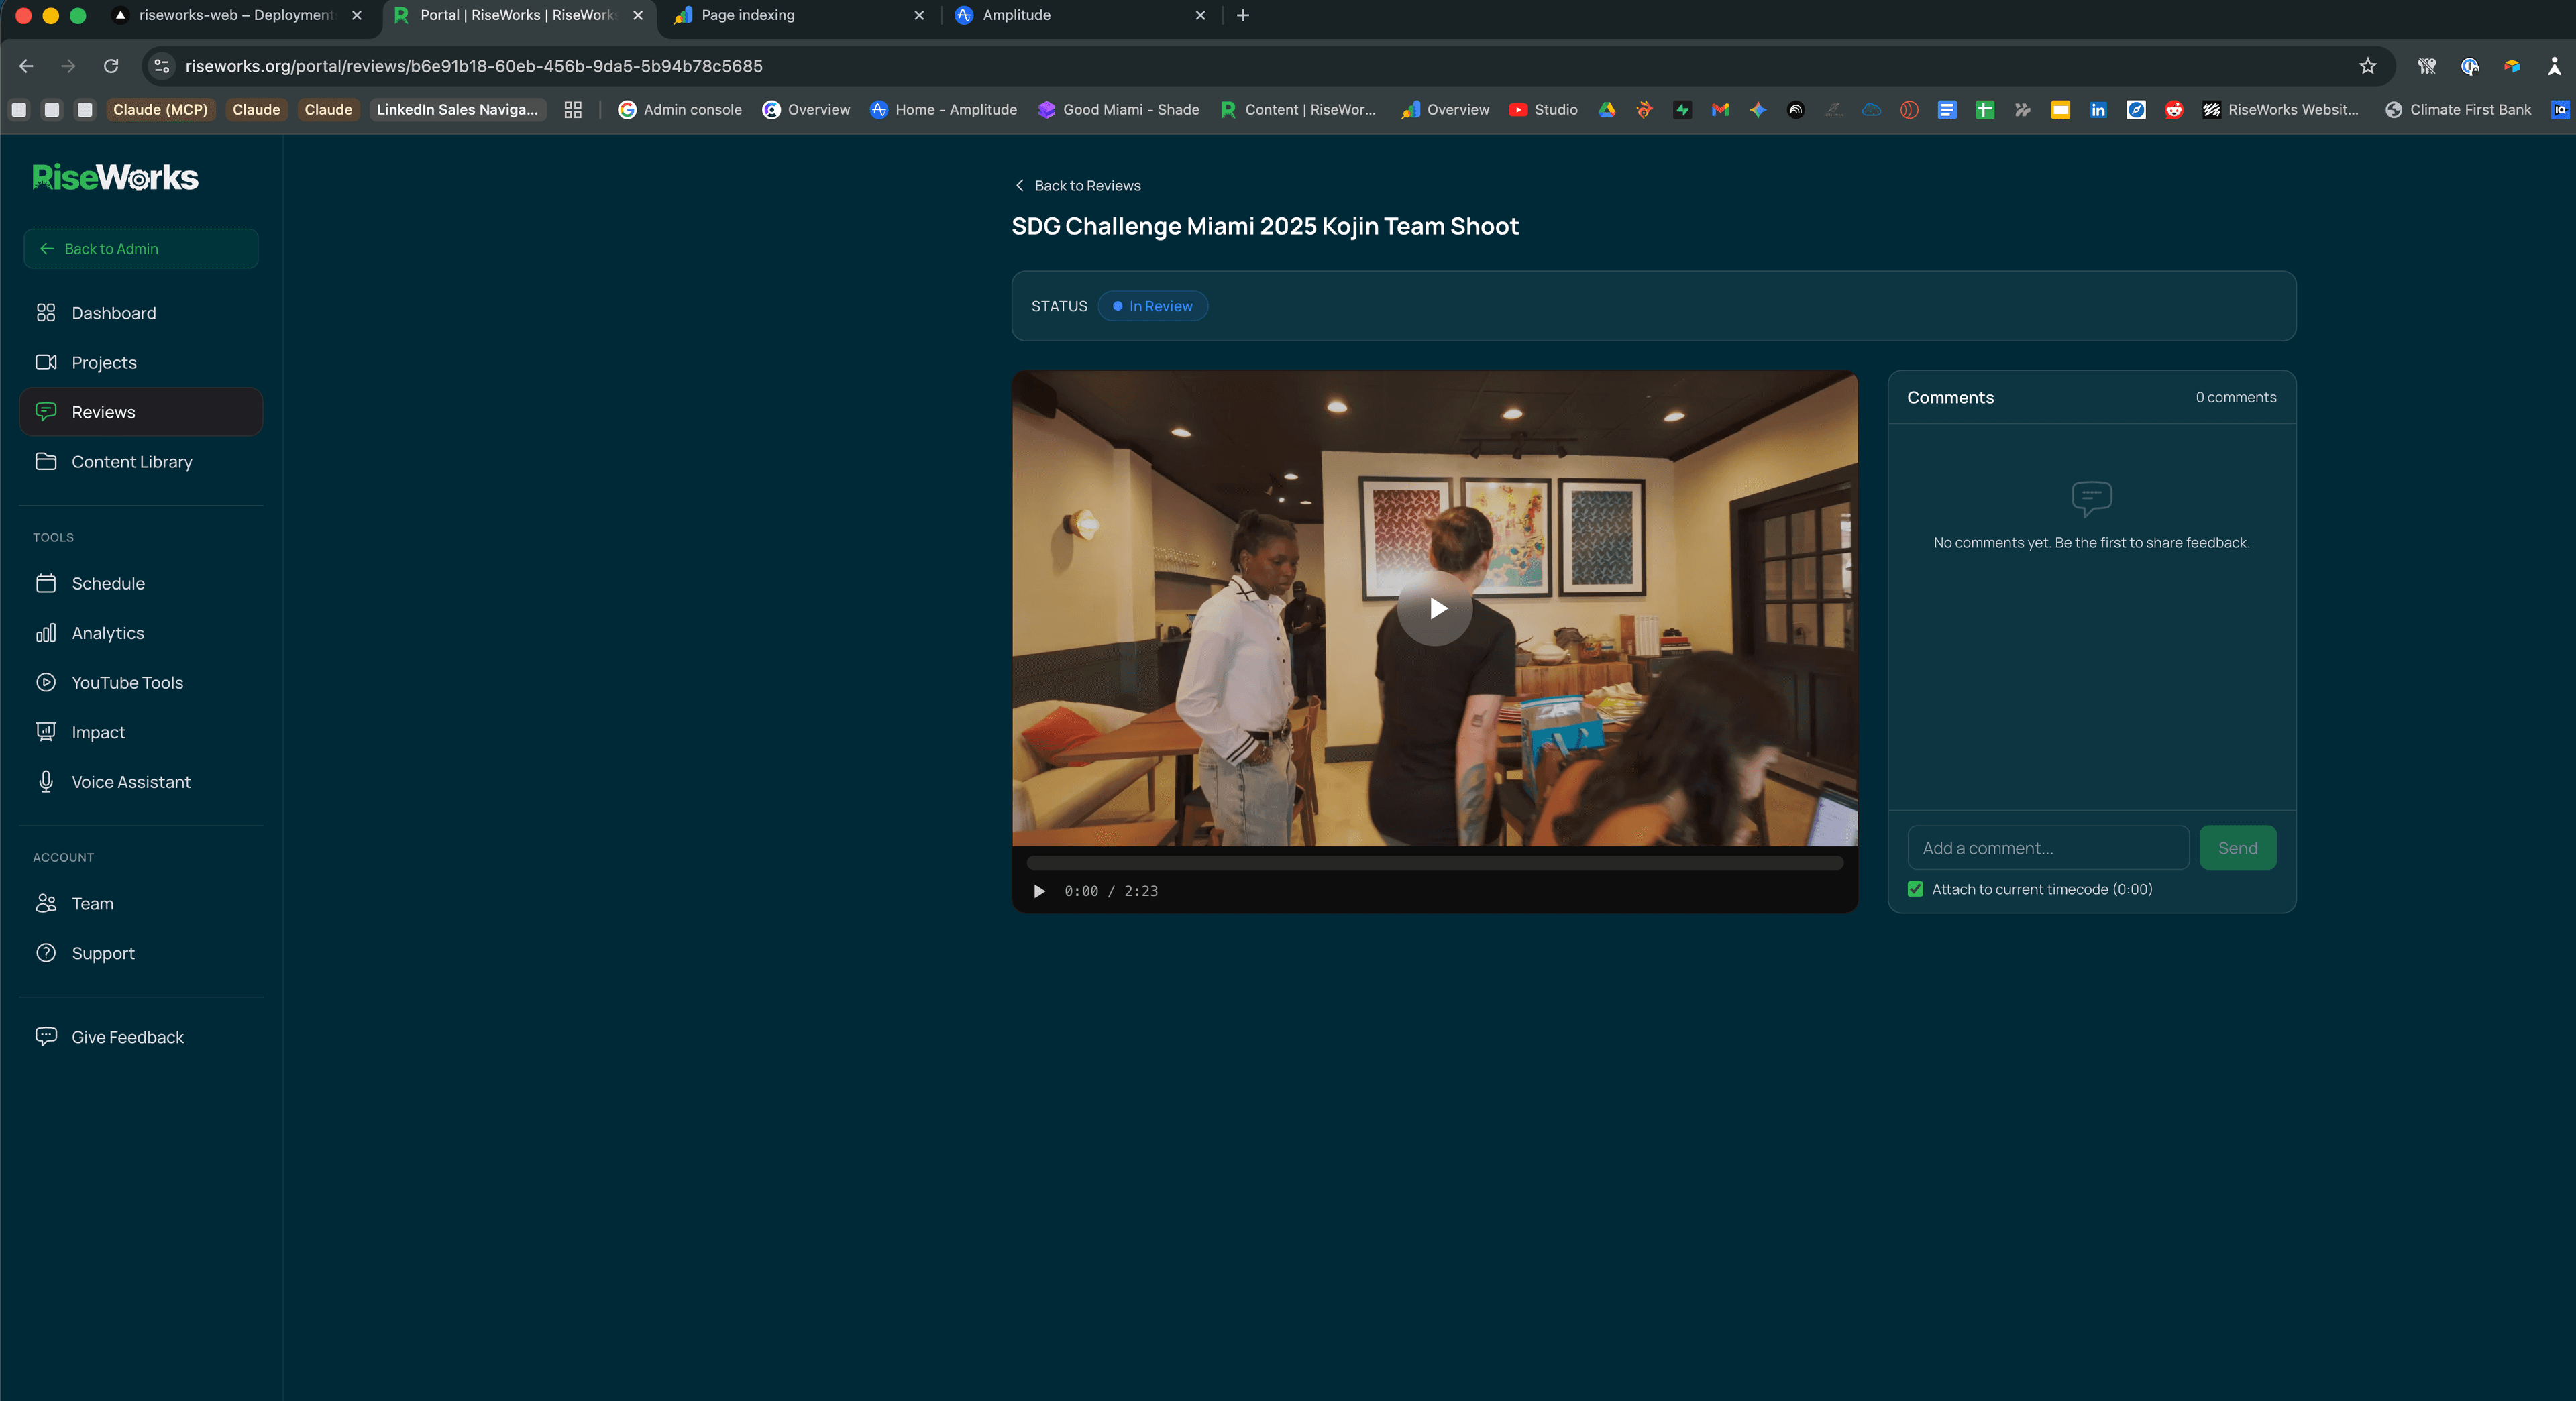
Review Edits — And Make Every Round Count
When a cut is ready, you review it directly in your dashboard. Drop comments at specific timestamps. Flag moments that need adjustment. Approve finals. Your feedback goes straight to your production team — no downloads, no file transfers, no miscommunication about “that part around the two-minute mark.”
Your feedback doesn’t disappear after the revision. Every comment is classified by our AI — what it’s about, what kind of change you’re requesting, how critical it is. Fix requests become tracked change orders with a resolution workflow. And once the video goes live, your editorial decisions get correlated with actual YouTube performance data — so over time, the system learns which kinds of feedback lead to better-performing content.
How it works
Timecoded commenting with AI classification. Every comment is categorized (hook, pacing, story, brand, CTA, captions) and typed (fix, question, idea, approval). Fix requests are tracked to resolution — nothing falls through the cracks.
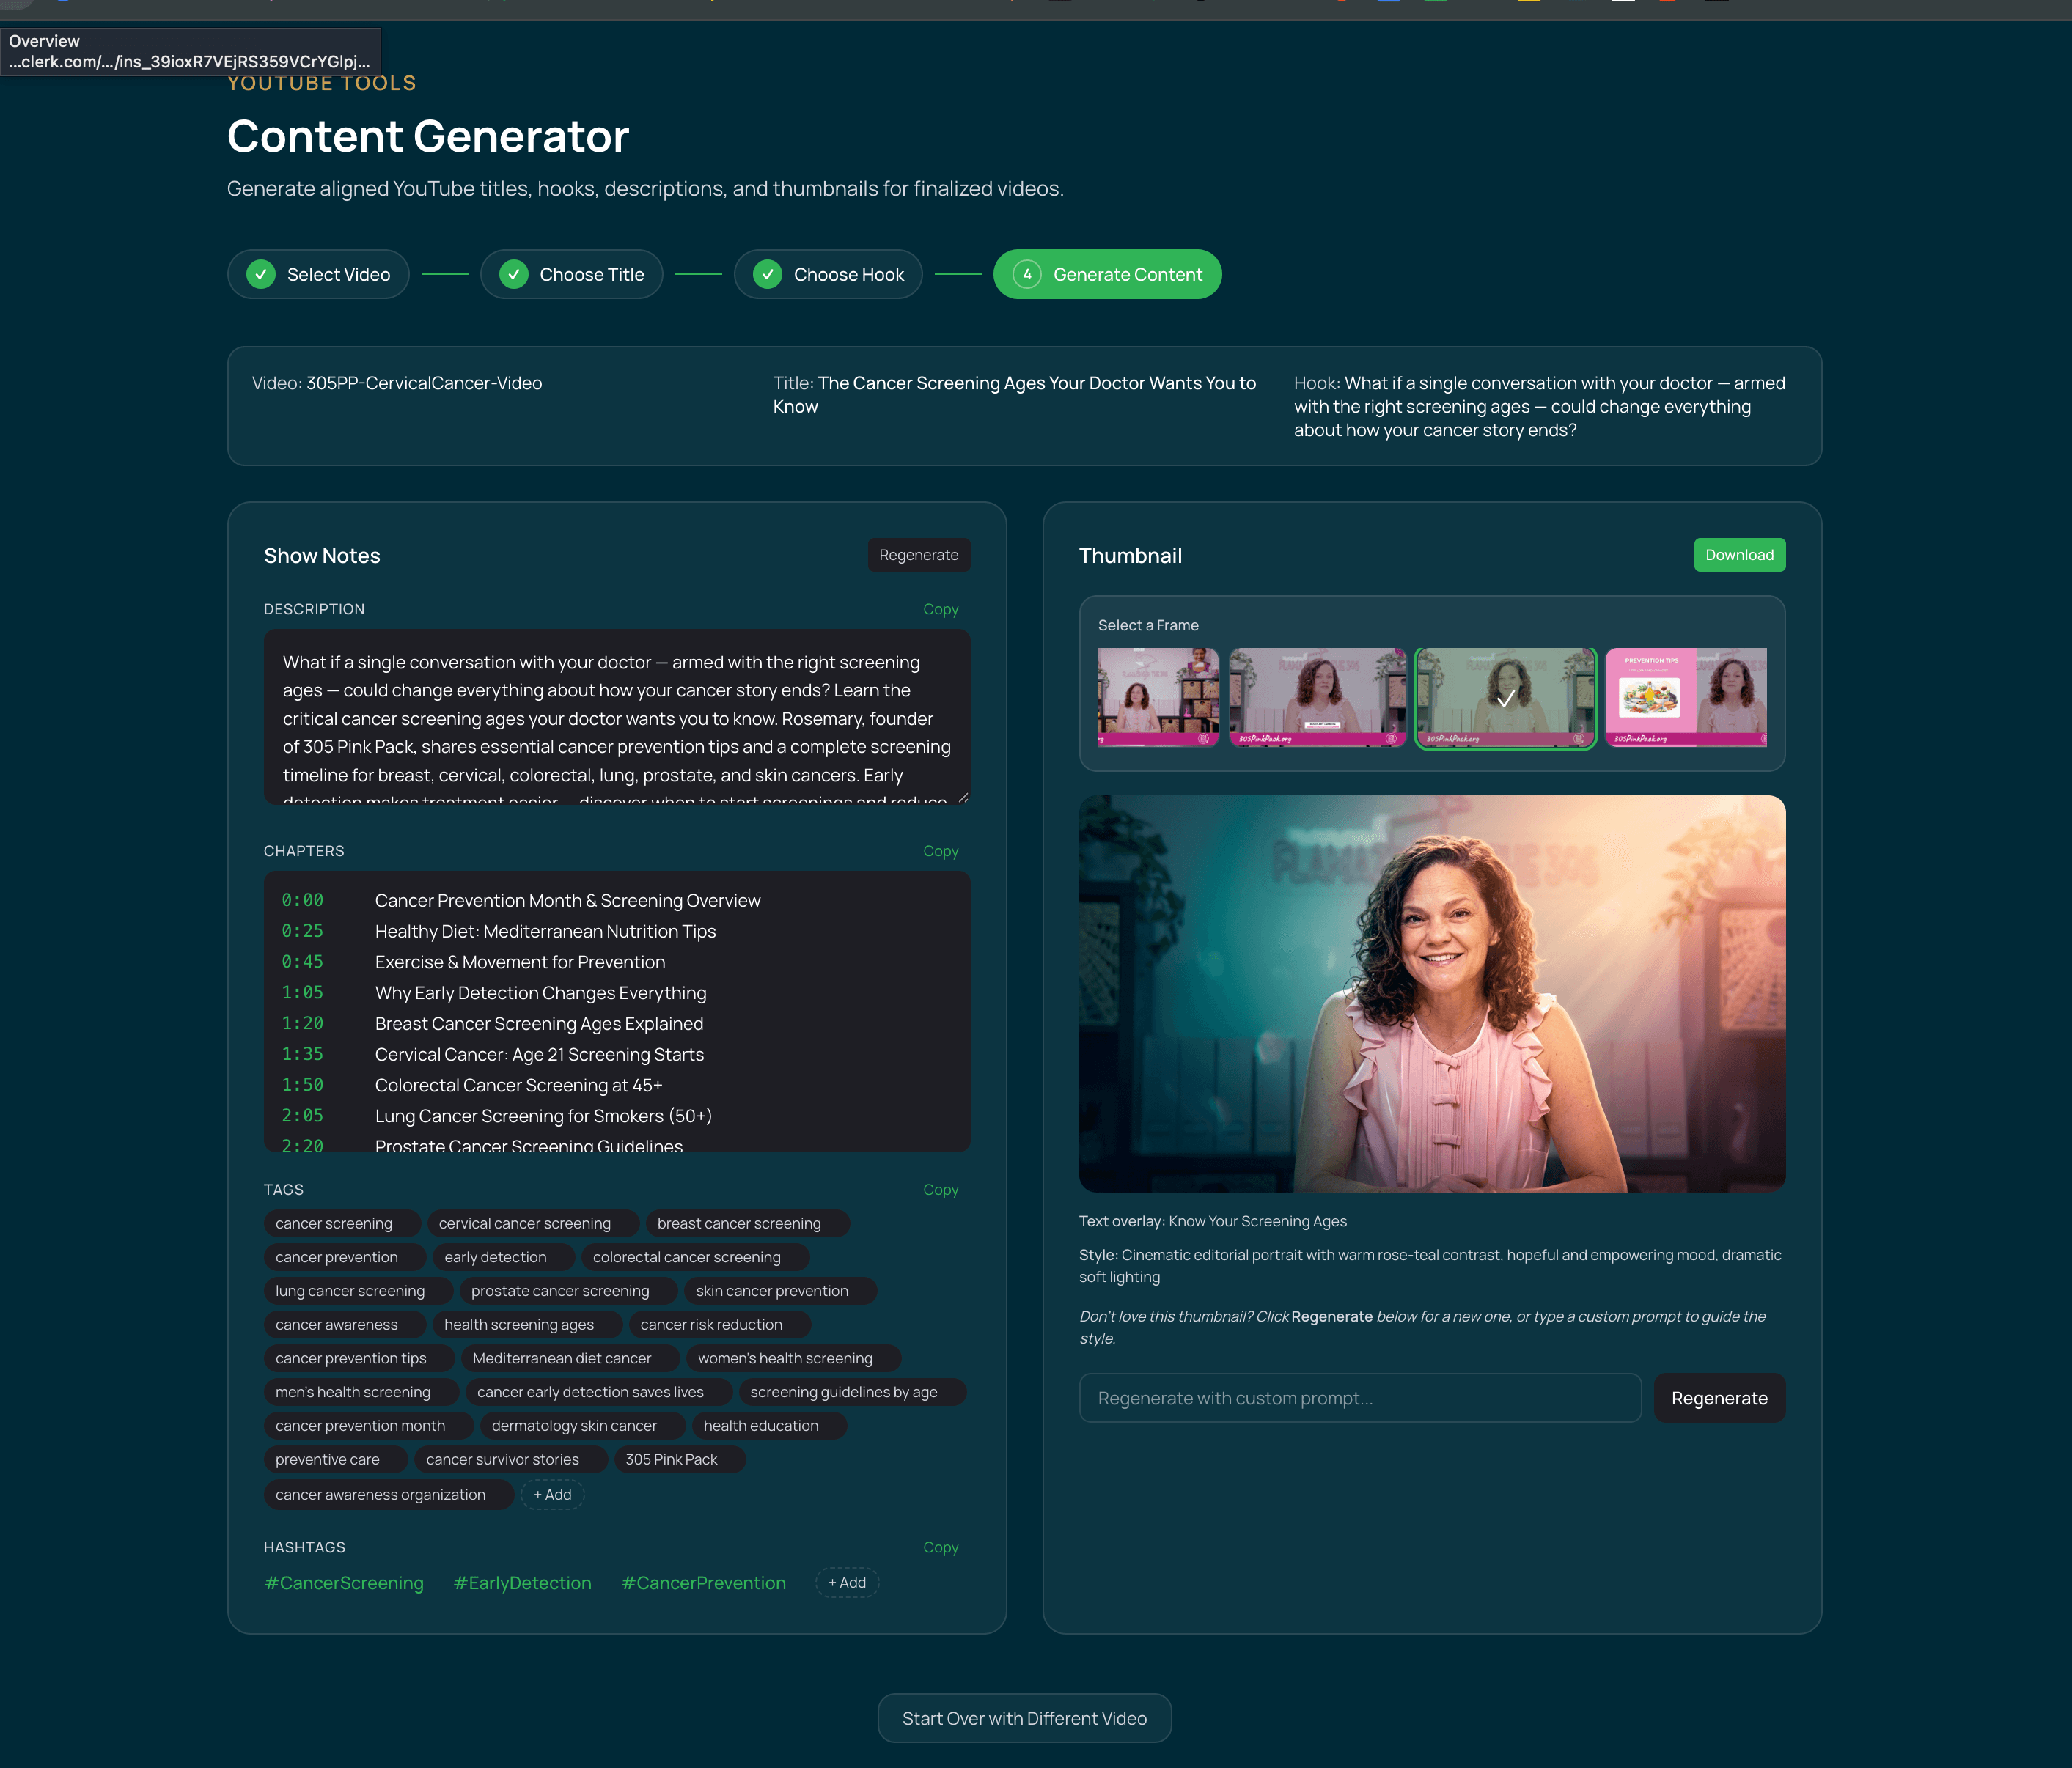
Every Video Leaves With a YouTube Strategy
Once your video is approved, Rough Cut and our AI content engine generate optimized titles, descriptions with chapters and timestamps, tags, hashtags, and show notes — all tailored to your content and audience.
The system generates thumbnail options from your footage and lets you customize the look with style prompting. Your finished video arrives packaged for discovery.
How it works
AI-generated content package: titles (categorized by approach — how-to, curiosity, story, challenge), hooks (surprising, emotional, educational, inspirational), full descriptions with chapters, tags, and custom thumbnails.
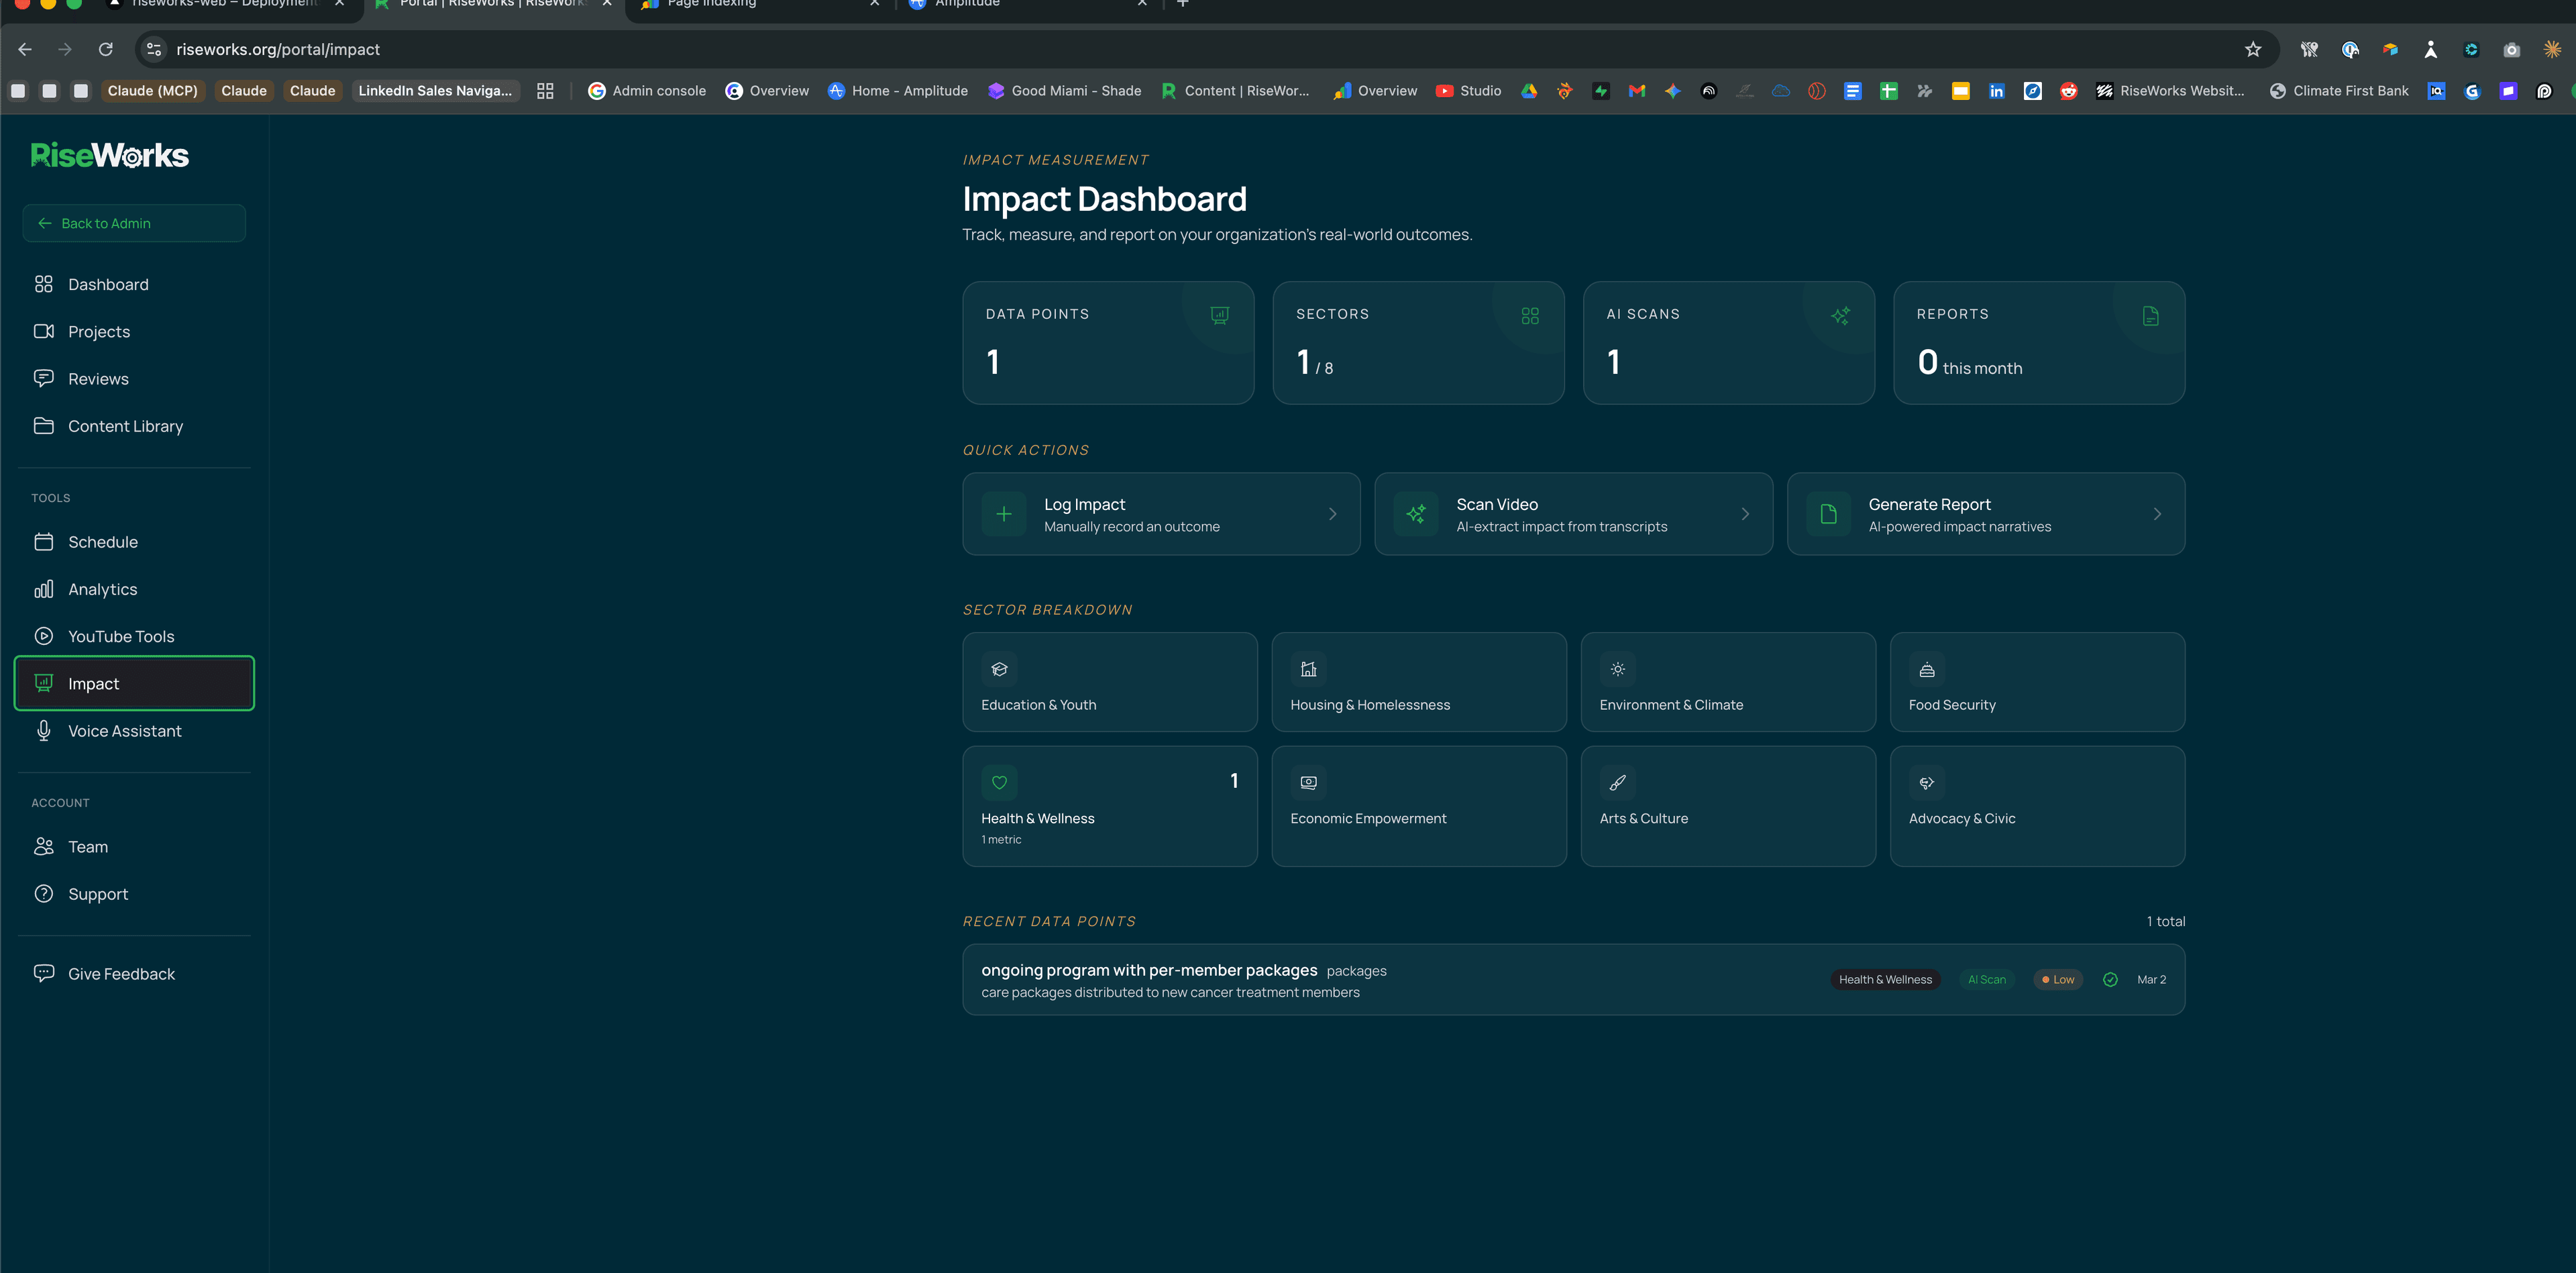
Track Real-World Impact and Where You Stand
Your dashboard tracks community outcomes across eight impact sectors — from housing and education to food security and economic empowerment. Log data manually, import spreadsheets, upload PDF impact reports, or connect your existing systems through our webhook API. Our AI extracts metrics from uploaded PDFs automatically, matching measures by meaning: “Meals Distributed” and “Food Packages Delivered” map to the same metric without manual wiring. When it’s time to report, the system generates board-ready impact summaries from your real numbers.
Your dashboard also connects to the same data engine that powers our public YouTube Benchmark — live rankings of 218+ nonprofit channels per metro, updated weekly. You see your own channel plotted against the field: subscriber growth, views per video, engagement rate, and upload consistency, compared to your local peers and national medians. The benchmark shows exactly where to focus first, and whether the content we’re producing together is closing the gap.
How it works
Multi-channel data ingestion: manual entry, CSV import with AI normalization, PDF extraction with semantic matching, and webhook API. Benchmarks tracked: subscribers, views per video, engagement rate, upload frequency, content format mix, and Spanish-language reach. Available metros: Miami, NYC, DC, LA, Chicago, Atlanta, Boston, Houston, SF, Denver, and Detroit.
Turn Every Project Into Intelligence for the Next One
Once a video goes live, the system automatically captures YouTube performance at day 1, 7, 28, and 90 — views, click-through rate, watch time, engagement. That data gets tied back to the specific feedback and editorial choices made during review. Over time, patterns emerge: which hooks hold attention, which pacing decisions drive higher completion rates, which CTAs convert. Your team gets a weekly AI-generated learning digest drawing on your own content and your own audience.
This is the same 360° loop described above — your data, the RiseWorks corpus, and the mission-economy benchmark, all feeding back into the next production cycle. Every project sharpens the intelligence behind the one that follows.
How it works
Automated performance capture at 4 milestones (day 1, 7, 28, 90). Weekly and monthly AI learning digests. Preflight readiness scoring before every publish — with pass/warning/fail items and performance predictions based on your content history.
Coming Soon
The Closed Loop
The More You Create, The Better It Gets
This is what a closed loop looks like: you book a session, we produce the content, you review it with timecoded feedback, we revise, our AI packages it for YouTube discovery, the system tracks performance and uses semantic intelligence to connect your assets, metrics, and insights across every project, correlates results with your editorial decisions, and feeds those learnings back into the next production cycle.
Every video you make with RiseWorks teaches StoryOS something. Every review comment, every performance milestone, every benchmark comparison sharpens the intelligence behind your next project. Engagement is the lever StoryOS can move; the real-world outcome is the goal. That's the architecture.
Building this took years — the story graph, the performance capture, the learning loop. With RiseWorks, it comes standard with your subscription.