← All MetrosSeattle For Impact
Competitive Intelligence
Seattle For Impact
YouTube Benchmark
Live rankings and performance data for 204+ for-impact YouTube channels across Seattle Metro.Updated weekly


0+
Channels Tracked
0
Combined Subscribers
0
Combined Views
0
Uploads Last 90 Days
Trending Now
Past 2 weeksTop uploads by views


All-Time Leaders
Top Channels


Seattle vs. National
Benchmark Intelligence
How Seattle nonprofit YouTube channels compare to national nonprofit and industry benchmarks — and where the biggest opportunities for growth are hiding.
Subscribers
Needs Work
163
Seattle Median
25th–75th: 47–882
National: 1.0K(NP Median)
The typical Seattle nonprofit has 163 subscribers vs. 1.0K nationally. Most local channels are in early growth — even reaching 1.0K puts you ahead of the national median.
Views / Video
Below National
286
Seattle Median
25th–75th: 152–854
National: 400(NP Median)
The typical Seattle channel gets 286 views per video vs. 400 nationally. Better thumbnails, SEO titles, and consistent posting can close this gap.
Engagement Rate
Needs Work
1.00%
Seattle Median
25th–75th: 0.4%–1.7%
National: 2.5%(NP Median)
Seattle's typical 1.00% engagement trails the 2.5% national median. Adding CTAs, responding to comments, and posting Shorts can boost this significantly.
Uploads / 90 Days
Needs Work
1
Seattle Median
104 of 204 active
National: 4(Active NP Median)
The typical Seattle nonprofit uploads 1 video per 90 days vs. 4 nationally. Only 104 of 204 channels are active. Consistency is the #1 growth lever.
What the Data Tells Us
🔍
The Gap Is Real
With a median of just 163 subscribers, most Seattle nonprofits have small audiences — but that's typical for local organizations. The average (6.3K) is higher because a few large channels pull it up. Even reaching 1K subscribers puts a channel in the top quartile locally.
📊
Why Medians Matter
We use medians because a few large channels (avg: 6.3K subs) skew the average 39× higher than the median (163). The median represents what the typical Seattle nonprofit actually looks like — and what you should benchmark against.
🚀
Biggest Growth Lever
100 of 204 channels haven't uploaded in 90 days. Consistency is the #1 predictor of growth. Channels posting weekly see 3-5× more views than monthly posters. This is Seattle's biggest opportunity.
National benchmarks sourced from M+R Benchmarks 2025, Rival IQ, Dash Social, and Social Blade nonprofit category data (2024–2025).
Subscriber Distribution
Where most channels fall — the majority have under 5K subscribers
Seattle Nonprofit Growth Playbook
Data-backed priorities ranked by potential impact — where Seattle nonprofits should focus to close the gap with national benchmarks
📅
Upload Consistency Is #1
High Impact100 inactive channels
100 of 204 channels haven't uploaded in 90 days. YouTube's algorithm rewards consistency — channels posting at least 2×/month see 3-5× more views than those posting sporadically. This is the single biggest lever for Seattle nonprofits.
💬
Close the Engagement Gap
High Impact1.00% vs. 5.4% national
Seattle's 1.00% median engagement is below the 5.4% national average for small channels. Quick wins: add a CTA in the first 30 seconds, pin a comment with a question, and respond to every comment within 1 hour to boost algorithmic ranking.
🔎
Fix Discoverability
High Impact286 vs. 2K national
The median Seattle channel gets 286 views/video vs. 2,000 nationally for similar-sized channels. Optimize titles for search (use keywords your audience Googles), create custom thumbnails with faces and text, and use 8-12 relevant tags per video.
🎯
Break the 1K Subscriber Barrier
Medium ImpactMedian: 163 subscribers
Half of all Seattle nonprofit channels have fewer than 163 subscribers. Reaching 1K unlocks YouTube monetization features and puts you in the top quartile locally. End screens, cross-promotion on email newsletters, and consistent thumbnails accelerate subscriber growth.
See how your channel compares to these benchmarks
Get a free YouTube audit with personalized recommendations in 30 seconds
AI Spotlight
Editor's Picks
Channels selected by AI for exceptional content quality and impact
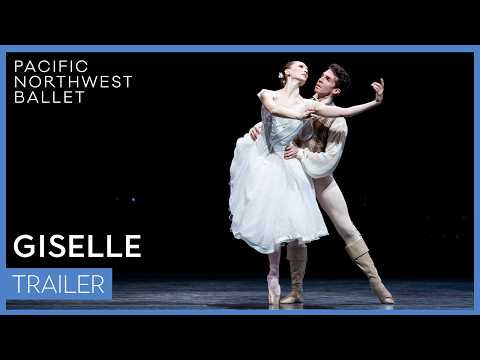
7/10
PNB's Giselle trailer 2026

Pacific Northwest Ballet Association
181.0K subscribers
PNB's channel shows genuine scale with 83M total views across 878 videos and a healthy 18.5% views-to-subscriber ratio, but the real signal is the FIREBIRD trailer pulling 215,617 views in recent weeks — 6.4x above the channel average — suggesting strong audience appetite for performance previews. Engagement rate of 0.75% is within nonprofit norms but avg comments of just 3/video indicates passive consumption rather than community dialogue. Caption coverage at 0% across 878 videos is a significant accessibility gap for a channel this established.
highOne of the most-subscribed a…

6/10
Shoplifter's sculptural glass process!
Museum Of Glass
226.0K subscribers
With 225K subscribers and 75.8M total views, the Corning Museum of Glass has built a massive content library (1,696 videos since 2007), but the avg views/video of 2,460 represents only 1.1% of subscribers — a classic symptom of a large legacy archive diluting recent performance. The bright spot is a 4.9% engagement rate, well above the 0.5–2% nonprofit benchmark, and a healthy 11.3 uploads/month cadence anchored by the new 'Glass in a Flash' series. However, caption coverage at just 2% across 1,696 videos is a significant accessibility failure for a major cultural institution.
highOne of the most-watched arts…
🏆 Curious where your nonprofit ranks?
Get an instant benchmark ranking + free YouTube audit in 30 seconds
Content Strategy
Content Format Breakdown
How Seattle nonprofits structure their YouTube content — from long-form storytelling to quick Shorts
Format Distribution
204 channels analyzed99%
Shorts-Heavy 3
Short-Form (<5m) 201
Mid-Form (5–15m) 0
Long-Form (15m+) 0
Upload Efficiency
Best avg views per video
1
Washington Health Alliance
1572 videos · 8.2M total views
2

The Institute For Functional Medicine
225 videos · 7.0M total views
3

Gates Foundation
976 videos · 17.1M total views
4
Village Theatre
403 videos · 2.9M total views
5

Seattle Aquarium Society-seas
317 videos · 5.3M total views
Shorts Champions
Most YouTube Shorts produced
Performance
Engagement & Format

Most Shorts
1
Pacific Northwest Ballet Association
@pacificnorthwestballet
42 shorts
2Overlake Medical Center & Clinics
@overlakemedicalcenter
42 shorts
3Roundglass Foundation
@roundglassfoundation
38 shorts
4Greater Good Charities
@greatergoodorg
37 shorts
5Seattle Childrens Theatre Association
@seattlechildrenstheatre
34 shorts
Trending NowPast month
Viral Hits
The most-viewed recent uploads across all tracked channels


2
14d ago
Finding Sanctuary | Elephant Family Gets a Life-Saving Feast!
Greater Good Chari…6.3K

3
28d ago
Dr. Claudia Fegan calls out corporate health insurers
Washington Physici…1.5K

4
24d ago
Providence St. Vincent's 100th heart transplant
Providence St Jose…256

5
29d ago
Bike Everywhere Lunch 2026: When Neighbors Ride Together
Cascade Bicycle Club218
6
29d ago
Kai - New Horizons
Schultz Family Fou…202
Community Builders
Comment Magnets
Channels sparking the most conversation — ranked by average comments per video
#
Channel
Avg Comments
1
Washington Policy Center
25.9K subs · 6.5K avg views
73
2

Invested
5.2K subs · 2.8K avg views
44
3
Roundglass Foundation
10.4K subs · 1.6K avg views
9
4
Museum Of Glass
226.0K subs · 2.6K avg views
8
5
Pacific Northwest Ballet Association
181.0K subs · 26.0K avg views
4
6
Seattle Aquarium Society-seas
20.6K subs · 30.4K avg views
4
7

Shanti Bhavan Childrens Project
5.0K subs · 5.5K avg views
4
8

Pacific Science Center Foundation
4.0K subs · 14.9K avg views
4
9

Museum Of Flight Foundation
36.1K subs · 3.0K avg views
3
10

Allen Institute
25.8K subs · 791 avg views
2
Contenido en Español
Spanish-Language Content
Original Spanish-language videos from nonprofits — a critical gap in markets with large Hispanic populations

32 en español
Bilingual
CADF 2023 | Alida Vicente, autoridad indígena de Guatemala
Seattle International Foundation · 32 Spanish videos

12 en español
Bilingual
Tooth•Apolooza - Tooth Traditions from Around the World
Imagine Childrens Museum · 12 Spanish videos

5 en español
Bilingual

The Imagine Institute - Imagine U Program - Provider Journey On Starting Child Care Business
Imagine Institute · 5 Spanish videos
4%
of tracked channels have any Spanish content
8
channels with Spanish videos out of 204 tracked
0
channels with Spanish as primary language
1
Seattle International Foundation
🌐 Bilingual · 32 Spanish videos · 89 subs
32 videos
en español
2
Imagine Childrens Museum
🌐 Bilingual · 12 Spanish videos · 870 subs
12 videos
en español
3
Imagine Institute
🌐 Bilingual · 5 Spanish videos · 250 subs
5 videos
en español
4
Brightspark Early Learning Services
🌐 Bilingual · 3 Spanish videos · 416 subs
3 videos
en español
5
Committee For Children
🌐 Bilingual · 1 Spanish video · 27.4K subs
1 video
en español
6
Starfire Sports A Nonprofit Corporation
🌐 Bilingual · 1 Spanish video · 471 subs
1 video
en español
7
Business Impact Nw
🌐 Bilingual · 1 Spanish video · 137 subs
1 video
en español
8
Crisis Connections
🌐 Bilingual · 1 Spanish video · 54 subs
1 video
en español
By Mission
Category Spotlights
Explore channels by mission area — click a category to see top performers
Mission Categories
Select a category
Click a mission category on the left to explore
top channels and videos in that area


💎 Could your channel be a Hidden Gem?
Small channels making outsized impact get featured. See how your content scores.
Analytics
Distribution and trends across all tracked channels
Subscriber Distribution — Top 20
Engagement Rate — Top 20
Upload Frequency — Videos in Last 90 Days
Engagement Rate vs. Subscriber Count
Bubble size = total views · Log scale on subscribers · Outliers top-left = high engagement, small audience
About RiseWorks: We produce monthly video, photo, and series content for nonprofits on a flat subscription. The Benchmark is how we give back to the sector.
Learn about our services →Join the Benchmark
Want your organization
included?
See how your YouTube channel stacks up against 204+ Seattle for-impact organizations. Get a free channel audit with personalized insights.
Data sourced from the YouTube Data API. Last updated 5/26/2026. Rankings reflect publicly available channel statistics.